Approach Using Genotyping by Exome Sequencing Leads to the Identification of a Primary Open Angle Glaucoma Associated Inversion Disrupting ADAMTS17 (12/18/2015)
PLOS ONE | DOI:10.1371/journal.pone.0143546 December 18, 2015
RESEARCH ARTICLE
A Novel Genome-Wide Association Study Approach Using Genotyping by Exome Sequencing Leads to the Identification of a Primary Open Angle Glaucoma Associated Inversion Disrupting ADAMTS17
Oliver P. Forman1*, Louise Pettitt1, András M. Komáromy3, Peter Bedford2, Cathryn Mellersh
- Kennel Club Genetics Centre, Animal Health Trust, Newmarket Suffolk, CB8 7UU, United Kingdom,
- Department of Clinical Science & Services, Royal Veterinary College, University of London, Hawkshead Lane, Hatfield, Hertfordshire, AL9 7TA, United Kingdom, 3 Department of Small Animal Clinical Sciences, College of Veterinary Medicine, Michigan State University, Veterinary Medical Center, 736 Wilson Road, East Lansing, MI, 48824–1314, United States of America
Abstract
Closed breeding populations in the dog in conjunction with advances in gene mapping and sequencing techniques facilitate mapping of autosomal recessive diseases and identification of novel disease-causing variants, often using unorthodox experimental designs. In our investigation we demonstrate successful mapping of the locus for primary open angle glaucoma in the Petit Basset Griffon Vendéen dog breed with 12 cases and 12 controls, using a novel genotyping by exome sequencing approach. The resulting genome-wide association signal was followed up by genome sequencing of an individual case, leading to the identification of an inversion with a breakpoint disrupting the ADAMTS17 gene. Genotyping of additional controls and expression analysis provide strong evidence that the inversion is disease causing. Evidence of cryptic splicing resulting in novel exon transcription as a con- sequence of the inversion in ADAMTS17 is identified through RNAseq experiments. This investigation demonstrates how a novel genotyping by exome sequencing approach can be used to map an autosomal recessive disorder in the dog, with the use of genome sequencing to facilitate identification of a disease-associated variant.
Introduction
It is well documented that population structure in the purebred dog can help to facilitate genome-wide association study (GWAS) approaches [1]. The development of most modern breeds within the last 200 years from small numbers of founding individuals has led to high levels of linkage disequilibrium (LD) within breeds. These high levels of LD lead to very strong signals of association being produced from GWASs for autosomal recessive diseases, even with very modest sample numbers [2]. Closed breeding populations, high levels of inbreeding and the extensive use of popular sires (dogs that closely fit the standard for a particular breed) can lead to rapidly emerging autosomal recessive disorders, as rare deleterious alleles are rapidly amplified. An example of an emerging autosomal recessive disorder is primary open angle glaucoma (POAG) in the Petit Basset Griffon Vendéen (PBGV).
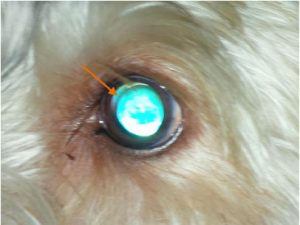
The first recognised case of POAG in the PBGV was identified in the United Kingdom in 1996 and recent survey work completed in 2014 has demonstrated a 10.4% prevalence for the disease (personal communication, Peter Bedford). The initial clinical features of POAG are usually seen in 3 to 4 year old dogs of either sex, the disease being characterised by a small, sustained rise in intraocular pressure (IOP) and lens subluxation. In approximately one third of affected dogs phacodonesis and the appearance of the aphakic crescent associated with lens subluxation are seen before a noticeable rise in IOP (Fig 1). There is no pectinate ligament abnormality and the iridocorneal angle remains open until the late stages of the disease, when globe enlargement has developed. Retinal degeneration and a cupping deformation of the optic papilla are only seen in late disease. Pain is not a feature and the quiet, chronic clinical nature of this disease means that often owners only become aware of the presence of POAG when either the globe enlargement or a vision problem becomes noticeable.
As POAG is an autosomal recessively inherited disease, mapping of which are facilitated by the high levels of LD described, we designed a novel GWAS approach using genotyping by exome sequencing methodology with 12 cases and 12 controls with the dual aim of identifying both the disease-associated locus and causal variant for POAG through a single experiment.
Fig 1. POAG case eye image. Left eye, 4 year old male PBGV: The eye is normotensive (18 mm. Hg.), but an aphakic crescent indicating lens subluxation is visible within the dorsal part of the dilated pupillary aperture.

Results
Genome-wide association study by exome sequencing (POAG)
Exome sequencing was carried out using a commercially available human exome capture kit to capture the exomes of 12 POAG cases and 12 breed matched control dogs. Illumina sequencing produced a 15.0 Gb dataset of 250 bp paired-end reads (sufficient for low coverage of ~5x). Alignment to the canine reference sequence CanFam3.1 and variant calling across all 24 individuals identified a total of 841,115 SNP and indel calls (variants). After filtering variants with a minor allele frequency (MAF) of less than 5% and genotyping frequency (GF) of less than 80%, 61,977 remained.
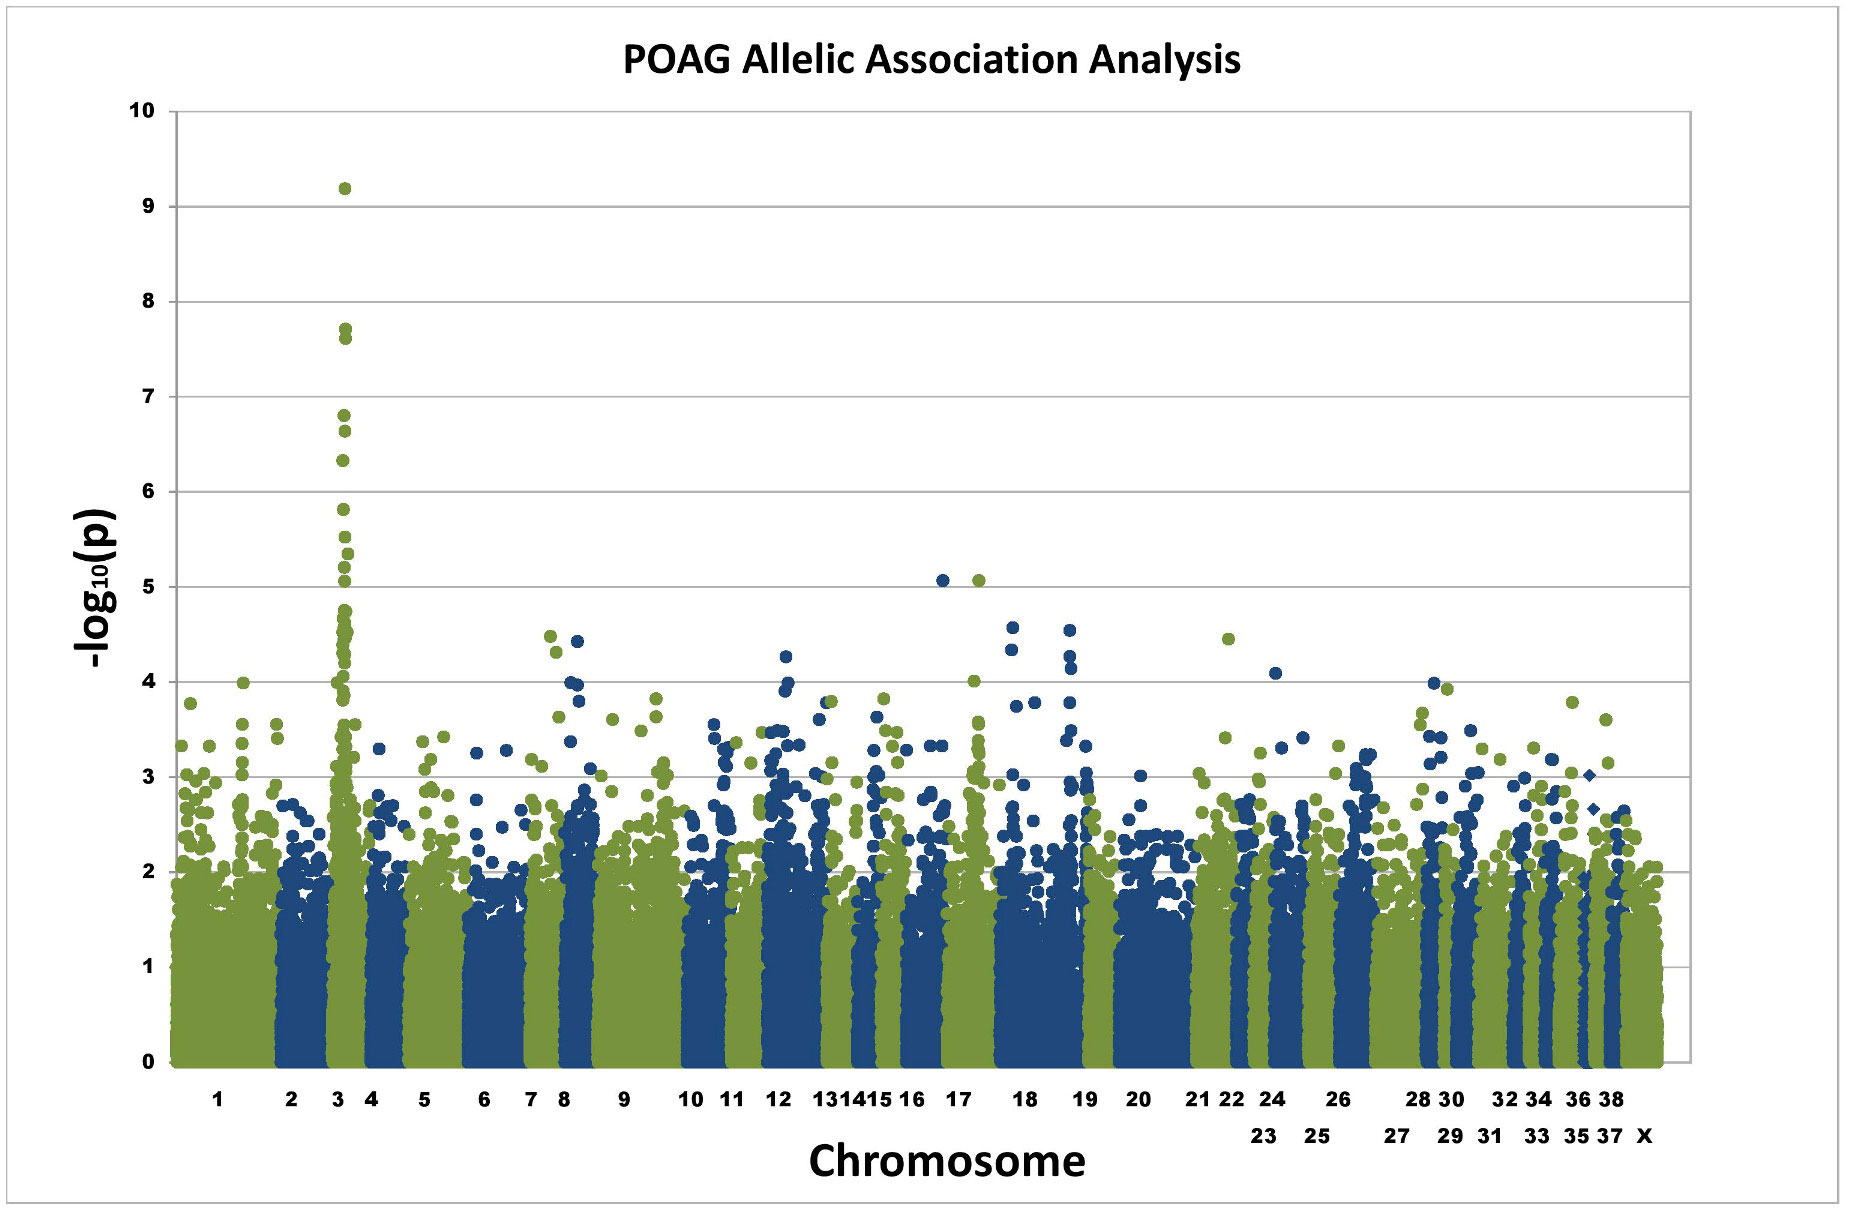
Basic allele association analysis identified a single signal of genome-wide significance on canine chromosome 3 (praw = 6.15×10⁻¹⁰)(Fig 2). The genomic inflation factor (based on median chi-squared) was 1.34. Correction for the effects of population substructure was performed using a mixed model approach (EMMAX) [3] and the strong single signal on chromo-some 3 remained (p = 1.34×10⁻⁹)(S1 Fig). The adjusted genomic inflation factor (based on median chi-squared) was 1.04.

Fig 2. Allelic association plot for POAG GWAS. Exome sequencing was used to generate SNPs for 12 POAG cases and 12 controls. Allelic association analysis identified a single signal on chromosome 3 of genome-wide significance.

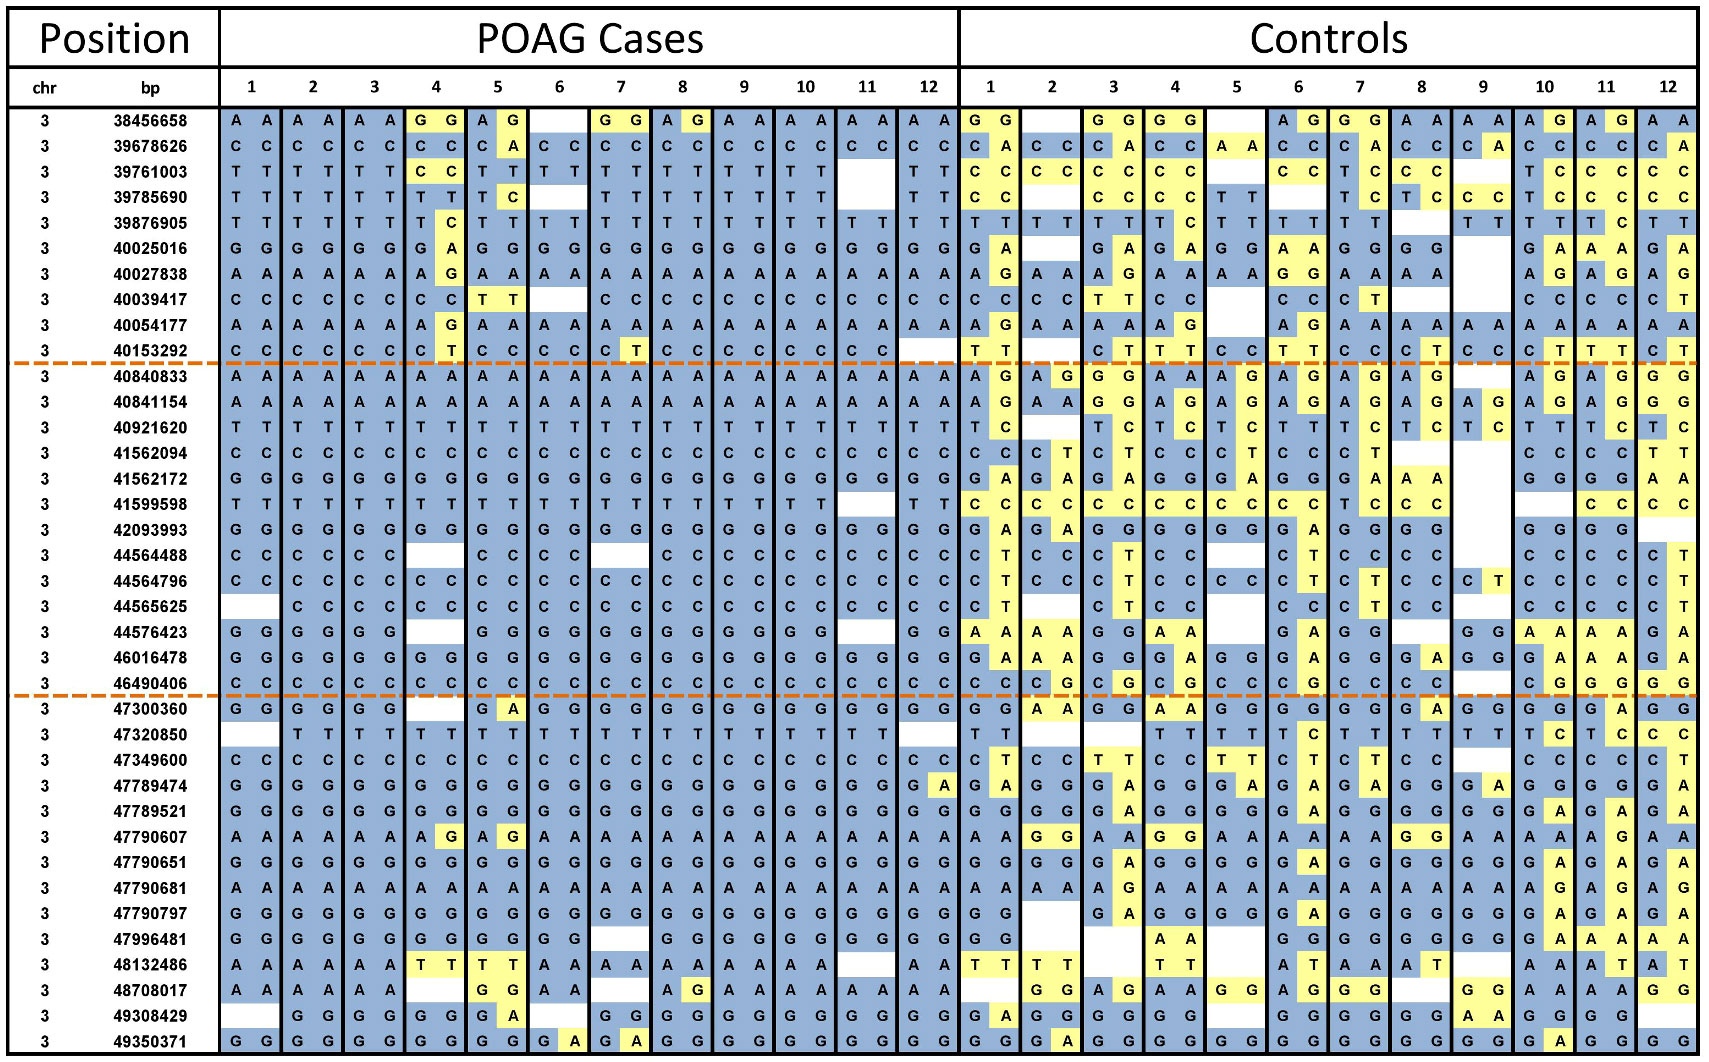
Fig 3. Genotyping data across the POAG disease-associated interval. Visualisation of the genotyping dataset across chromosome 3 was used to identify the disease-associated interval. Loss of homozygosity in cases defined the boundaries of the associated interval (orange dashed lines). Minor alleles are shown in yellow and major alleles in blue.
Visual analysis of the raw genotyping data revealed a disease associated interval of chr3:40,153,292–47,300,360 based on the CanFam3.1 genome build (Fig 3). All cases were homozygous for the disease-associated haplotype. The disease-associated interval contained 28 genes, including ADAMTS17, a potential glaucoma candidate gene. A list of interval genes can be found in S1 Table. As all cases were homozygous for the disease-associated haplotype the exome sequencing datasets were combined for all cases to increase read depth for interrogation of the disease-associated interval. As the human kit was used for target enrichment, capture of canine exons was incomplete (approximately 80%). For ADAMTS17 additional exon resequencing was performed to cover all exons, in three POAG cases and three controls, although no coding or splice site variants were identified.
The SNP with the lowest p-value from the GWAS (top SNP) was a non-synonymous SNP in the SYMN gene (chr3:41,599,598). Conservation analysis across vertebrate species showed weak conservation of this residue, with a number of naturally occurring amino acids at this position. The variant is also predicted to be tolerated by SIFT. In total, 2,696 SNPs and indels were identified across the disease-associated interval, including 12 non-synonymous variants, although none segregated fully with disease status (i.e. homozygotes for the non-reference allele were present in both case and control sets). A list of non-synonymous variants with consequent predictions is shown in S2 Table.
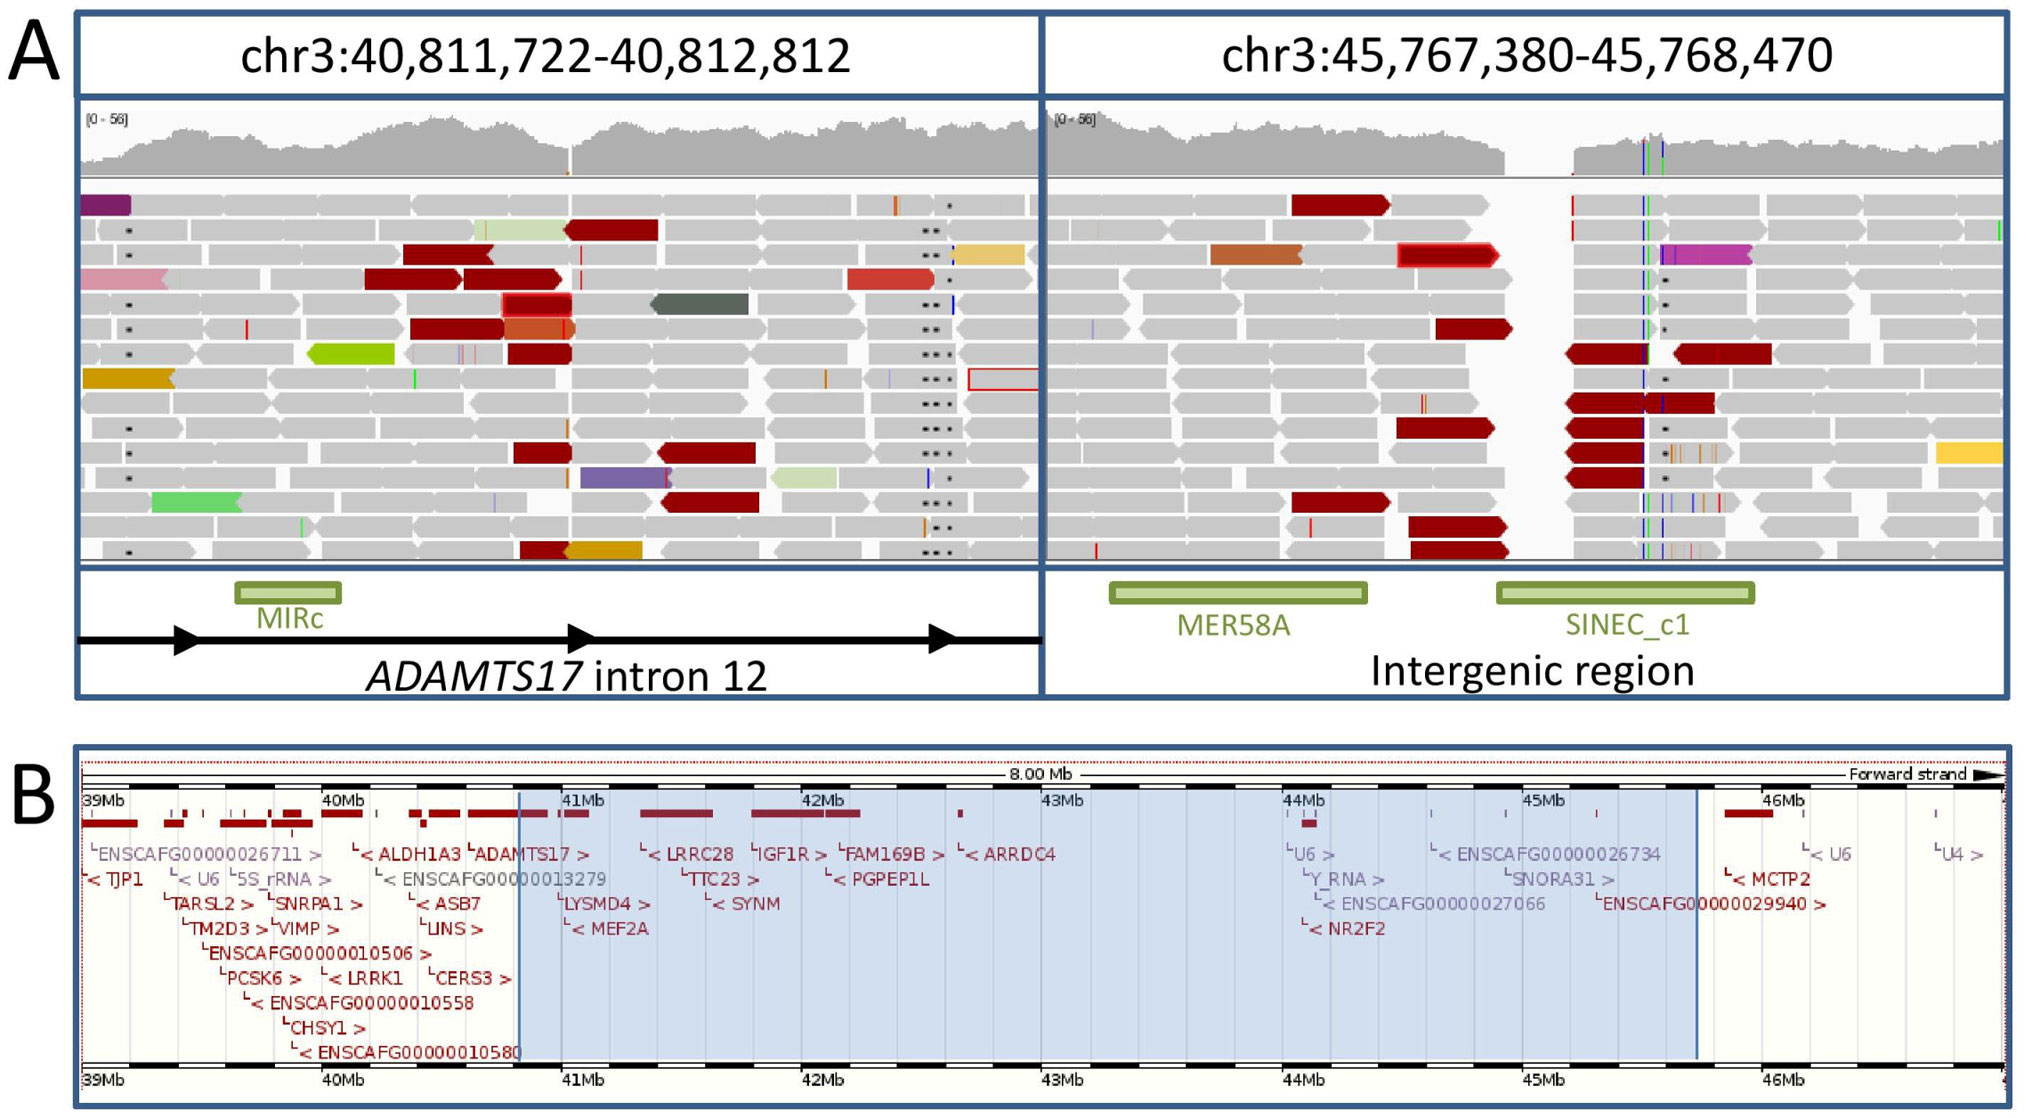
The disease-associated interval was further investigated by genome resequencing of a single POAG case. To consider intronic, exonic and intergenic regions in detail, sequence read align-ments were visually scanned using the Integrative Genomics Viewer (IGV) [4]. Sequence read alignments indicative of a 4.96 Mb inversion were identified with breakpoints in intron 12 of ADAMTS17 (chr3:40,812,274) and a downstream intergenic region (chr3:45,768,123) (Fig 4).

Fig 3. Genotyping data across the POAG disease-associated interval. Visualisation of the genotyping dataset across chromosome 3 was used to identify the disease-associated interval. Loss of homozygosity in cases defined the boundaries of the associated interval (orange dashed lines). Minor alleles are shown in yellow and major alleles in blue.
Expression analysis
To gauge whether the inversion had an impact on gene expression, limited qRT-PCR experiments were performed. Tissues for RNA extraction were selected based on the availability of suitable case and control material and assessment of
expression levels of ADAMTS17 using RNAseq data generated in previous studies (data not shown). In a comparison of retinal cDNA from one POAG case against one control, results suggested a 2.4 fold increase in ADAMTS17 expression upstream of the inversion for the POAG case relative to the control. No ADAMTS17 expression was detected downstream of the inversion for the POAG case. (Full results are shown in S1 Dataset).
RNAseq data generated from retinal RNA of one POAG case, showed concordance with the results of qPCR analysis. Expression of novel exons as the result of cryptic splicing was observed after the final normally transcribed exon of ADAMTS17 before disruption by the inversion. An example of a novel exon established through a cryptic splicing event is shown in Fig 5. A schematic diagram of ADAMTS17 exon arrangement is shown in Fig 6.
Table 1. Genotyping of an extended PBGV sample set for the POAG-associated inversion.

Results of genotyping 212 PBGV for the POAG associated inversion, where + represents the reference allele and INV represents the inversion allele.

Results of genotyping 212 PBGV for the POAG associated inversion, where + represents the reference allele and INV represents the inversion allele.
Leave A Comment